Reading Carencia as Opportunity

Por la mañana yo me levanto
In the morning I get up
No me dan ganas de ir a trabajar
I don't feel like going to work
Subo a la combi [1] voy observando
I get into the van and I'm observing
Que toda la gente comienza a pasar
That all the people begin to pass
Por la avenida va circulando
It is circulating along the avenue
El alma obrera de mi ciudad
The working soul of my city
Gente que siempre esta trabajando
People who are always working
Y su descanso lo ocupa pa' soñar
And they take their free time only to rest
— La Carencia, Panteón Rococó (2002)
Artículo
La Carencia is a very popular ska song in Mexico by the band of the same genre and country, Panteón Rococó. Due to its origins and ideologies, Panteón Rococó's music usually tackles themes related to political and social issues. La Carencia is a song that tells the day-to-day experience of the average citizen in the Mexico City Metropolitan Area (and that can be applied to other cities in the world as well), as it talks about how daily routines are shaped by how housing, employment, mobility and transportation are spatially arranged. Rather than portraying individual hardship, La Carencia points to shared conditions lived in the metropolitan area: daily life routine is defined by distance, connectivity and the spatial organization of work and housing.
The Mexico City Metropolitan Area (known internationally as Greater Mexico City) is the largest metropolitan area in Mexico, concentrating almost one third of the country’s metropolitan population. Greater Mexico City has a population of approximately 21.4 million people, while the second and third largest metropolitan areas (Monterrey and Guadalajara) have around 5.3 million and 5.1 million inhabitants, respectively. In total, the country’s 48 metropolitan areas are home to about 67.6 million people.
In a metropolitan area as big and complex as Mexico City (in both terms of population and geographical size), carencia is not only about income. It brings to the light the many areas of opportunity in distance, connectivity, and transportation to reconfigure the current systematical structure around space. That said, as said before, daily routines are shaped not by individual choice, but by the spatial arrangement of housing, employment, and mobility infrastructure throughout the metropolitan area.
If daily routines in the metropolitan area are shaped by spatial factors, then carencia cannot be understood only through individual anecdotes, such as Luis Castillo’s experience described in the article "This is what it’s like to work in Mexico City and live in the State of Mexico: A six-hour commute on public transport". While these stories make the condition visible, carencia must be analyzed spatially to understand its structural roots. Mapping how people, jobs, housing pressures, and transportation networks overlap allows us to move from individual experience to collective patterns. Through this lens, it becomes possible to identify where effort accumulates, where access concentrates, and where the metropolitan system presents opportunities to better align daily life with mobility, employment, and space.
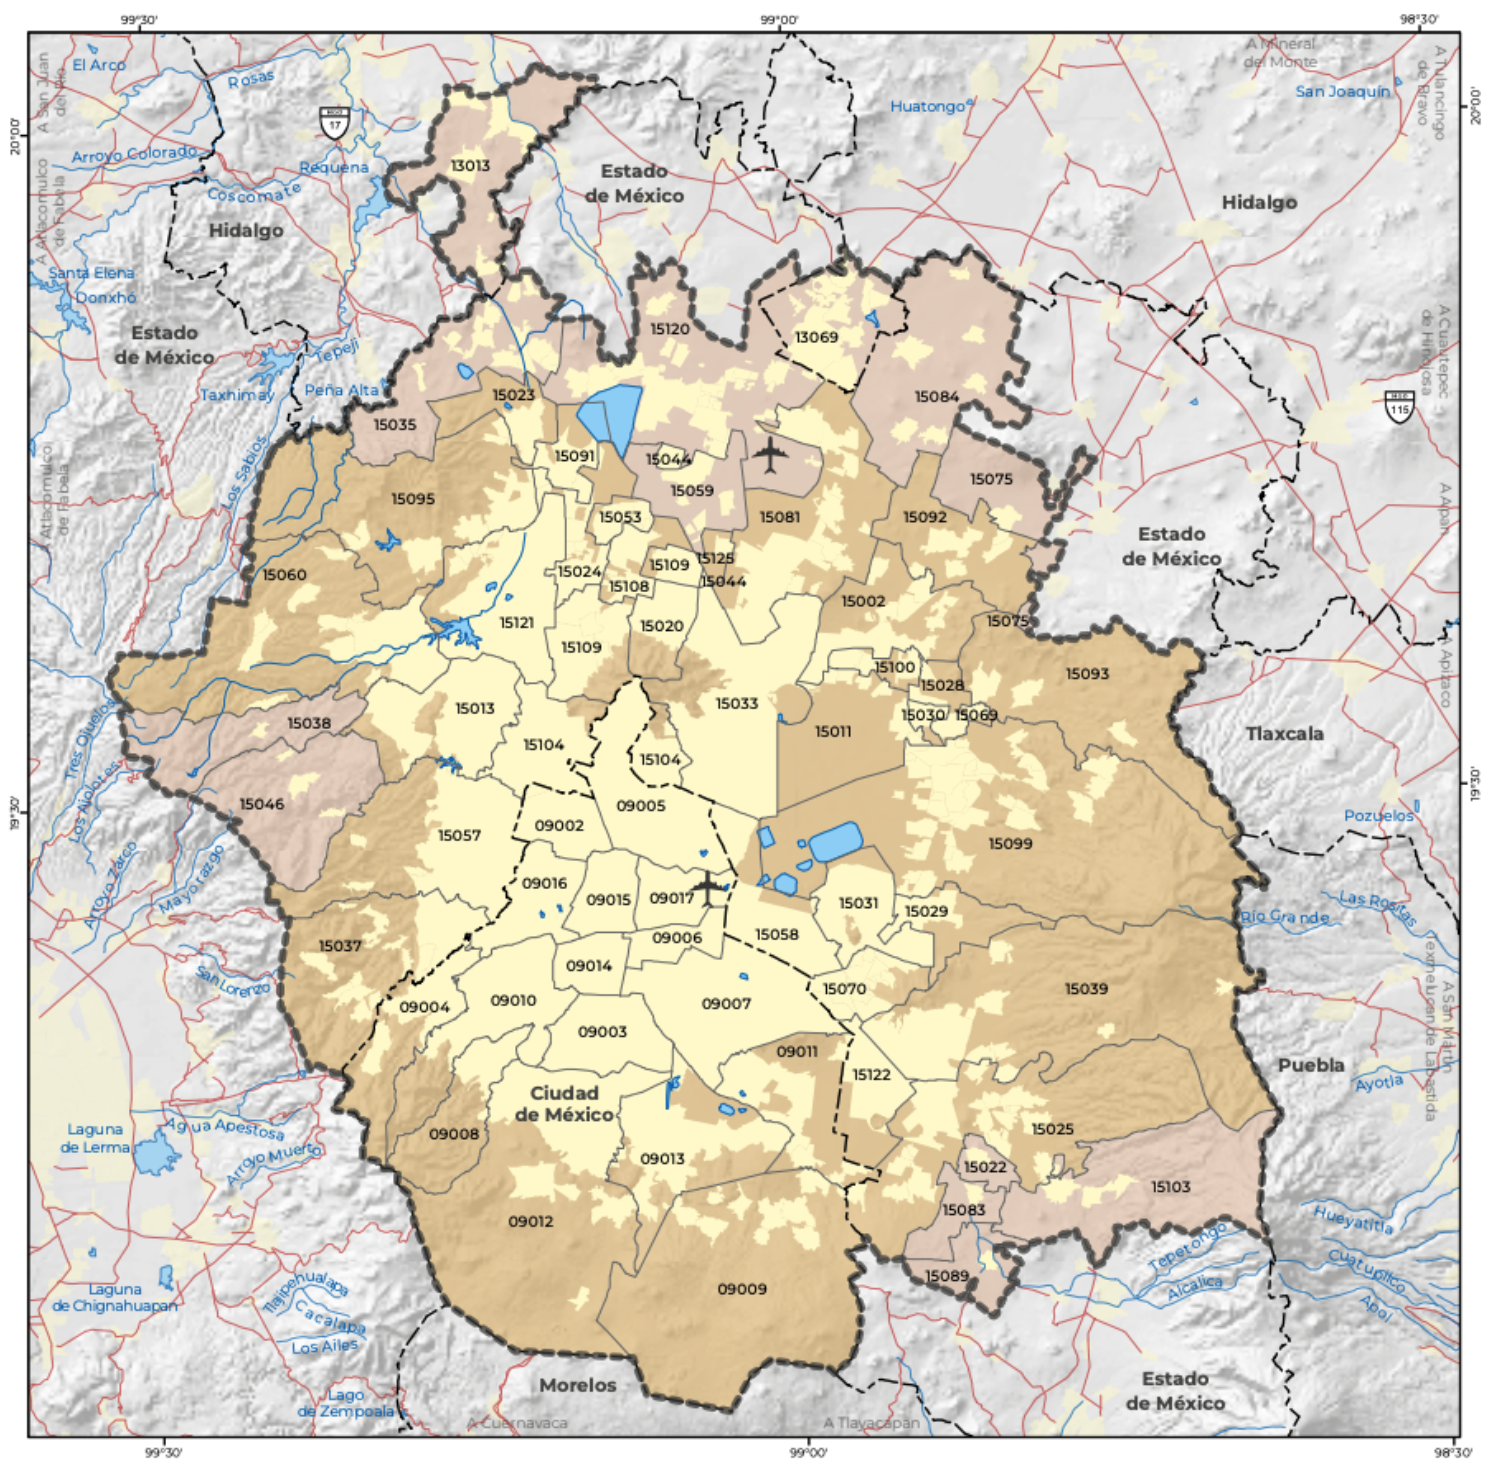
Figure 1. Cartography of the Greater Mexico City Metropolitan Area. Greater Mexico City is composed of 63 municipalities across three states: Mexico City (16 municipalities), the State of Mexico (45 municipalities), and Hidalgo (2 municipalities).
To analyze these patterns, it is necessary to normalize space across the metropolitan area. For this reason, the city was divided into a grid of hexagons, each representing one square kilometer [2]. This approach makes it possible to compare different dimensions of urban life using a common spatial unit, avoiding the complications that arise from working with administrative boundaries of varying sizes and shapes. Rather than emphasizing exact counts or rankings, the analysis focuses on spatial relationships, such as where population density diverges from the concentration of jobs across the metropolitan landscape.
![Population density in the Greater Mexico City Metropolitan Area. A hexagonal grid with cells of approximately one square kilometer displays population density using data from the 2020 Census [3]. The grey line marks the boundary of Mexico City, while the red line indicates the boundaries of the State of Mexico and the State of Hidalgo.](/en/assets/images/figure2-52dad5dfff0527d6b1bd1bdd67c6ef4f.png)
Figure 2. Population density in the Greater Mexico City Metropolitan Area. A hexagonal grid with cells of approximately one square kilometer displays population density using data from the 2020 Census [3]. The grey line marks the boundary of Mexico City, while the red line indicates the boundaries of the State of Mexico and the State of Hidalgo.
Mapping population density across the Greater Mexico City area provides a first insight into where people live. As shown in Figure 2, some of the densest hexagons are concentrated near Mexico City’s urban core. However, many other high-density clusters appear along the metropolitan periphery, with some extending farther into the State of Mexico. This pattern does more than locate residents; it highlights where everyday routines, such as commuting, caregiving, and daily travel, are spatially anchored. In this sense, population density becomes a proxy for where daily life unfolds and where the demands of mobility are most consistently felt.
![Economic corridors in the Greater Mexico City Metropolitan Area. A hexagonal grid with cells of approximately one square kilometer shows the concentration of economic corridors [4]. The grey line marks the boundary of Mexico City, while the red line indicates the boundaries of the State of Mexico and the State of Hidalgo.](/en/assets/images/figure3-ef170bc7945043733cb78d6e728a7801.png)
Figure 3. Economic corridors in the Greater Mexico City Metropolitan Area. A hexagonal grid with cells of approximately one square kilometer shows the concentration of economic corridors [4]. The grey line marks the boundary of Mexico City, while the red line indicates the boundaries of the State of Mexico and the State of Hidalgo.
Mapping the concentration of economic corridors reveals a spatial pattern with significant metropolitan implications. As shown in Figure 3, economic activity is primarily clustered around Mexico City’s central areas, forming dense corridors of employment that extend through a limited number of hexagons. Beyond these zones, the presence of economic corridors declines noticeably, particularly across the metropolitan periphery in the State of Mexico and Hidalgo. This spatial configuration highlights a contrast between where people live and where employment concentrates: while population density extends far beyond the city’s core, economic corridors remain largely centralized. As a result, access to employment opportunities becomes increasingly dependent on long-distance travel. In practical terms, many daily commutes are not short movements between neighboring areas, but extended journeys connecting peripheral residential zones to centralized areas of economic activity.
![Distribution of short-term rental listings (Airbnb) in the Greater Mexico City Metropolitan Area. A hexagonal grid with cells of approximately one square kilometer displays the concentration of Airbnb listings [5]. The grey line marks the boundary of Mexico City, while the red line indicates the boundaries of the State of Mexico and the State of Hidalgo.](/en/assets/images/figure4-bd077002b0e5697bba96a7acf6dcd0ab.png)
Figure 4. Distribution of short-term rental listings (Airbnb) in the Greater Mexico City Metropolitan Area. A hexagonal grid with cells of approximately one square kilometer displays the concentration of Airbnb listings [5]. The grey line marks the boundary of Mexico City, while the red line indicates the boundaries of the State of Mexico and the State of Hidalgo.
Mapping the distribution of short-term rental listings reveals a strong spatial pattern. As shown in Figure 4, Airbnb activity is almost exclusively clustered in Mexico City’s central areas, with little to no presence across most of the metropolitan periphery. This concentration suggests that the short-term rental market is not evenly distributed, but instead focused on a limited number of neighborhoods where accessibility and amenities already converge. Rather than operating as an isolated phenomenon, this pattern intersects with population density and economic corridors, highlighting areas where housing demand is shaped simultaneously by residents, workers, and visitors. In this context, short-term rentals function as an indicator of market pressure, pointing to zones where housing is subject to multiple, overlapping demands within the metropolitan system.
![Public transportation accessibility in the Greater Mexico City Metropolitan Area based on network analysis. Accessibility is calculated along the street network, with colored network edges representing the number of public transport stops reachable within a 20-minute walking distance from each street segment [6]. The grey line marks the boundary of Mexico City, while the red line indicates the boundaries of the State of Mexico and the State of Hidalgo.](/en/assets/images/figure5-9ecc0f79ce482131a944438ab812e9df.png)
Figure 5. Public transportation accessibility in the Greater Mexico City Metropolitan Area based on network analysis. Accessibility is calculated along the street network, with colored network edges representing the number of public transport stops reachable within a 20-minute walking distance from each street segment [6]. The grey line marks the boundary of Mexico City, while the red line indicates the boundaries of the State of Mexico and the State of Hidalgo.
Mapping access to public transportation through network analysis reveals how mobility is experienced along the street network, rather than at isolated points. As shown in Figure 5, darker network segments indicate streets from which a greater number of public transport stops can be reached within a 20-minute walk. These high-access corridors are strongly concentrated in Mexico City’s central areas, where transport lines, routes, and services intersect. Moving outward from the core, network segments gradually shift toward lower values, reflecting fewer reachable stops and more limited route options across much of the metropolitan periphery. This pattern highlights how mobility is structured not only by the presence of transit infrastructure, but by how walkable access to that infrastructure is distributed across space. In practical terms, residents in peripheral areas must often invest more time and effort—through longer walks and fewer network connections—to access the same metropolitan opportunities concentrated in the urban core.
Viewed together, these spatial layers reveal a consistent pattern. Population density extends well beyond the city’s core, while economic corridors, short-term rental activity, and high levels of transit accessibility remain far more centralized. Carencia emerges not in any single map, but in the overlap between them: where large numbers of people live at a distance from concentrated employment, where housing markets face multiple pressures, and where access to mobility requires greater daily effort. In these areas, distance becomes a determinant on how time, energy, and opportunity are distributed across the metropolitan system.
While these maps make structural patterns visible, they do not capture the full complexity of daily life. Informal economies, unpaid care work, flexible schedules, and personal coping strategies remain largely invisible in spatial data. Nor do the maps convey the emotional and physical toll of long commutes, fragmented journeys, or unreliable connections. Acknowledging these limits is essential: the analysis does not replace lived experience, but rather provides a framework for understanding how those experiences are systematically produced across space.
These patterns matter because they are not accidental. They reflect decades of planning decisions, infrastructure investments, and market dynamics that have shaped where people live, where jobs concentrate, and how mobility is organized. Understanding carencia as a spatial condition allows urban decision-making to move beyond individual explanations and toward systemic questions: where connectivity can be strengthened, where access can be redistributed, and where existing urban assets can be better aligned with population growth.
Too often, discussions about commuting and mobility focus on personal choices—where people decide to live or how far they are willing to travel. The spatial patterns shown here suggest a different framing. Daily routines in the metropolitan area are less a matter of preference than of access. When employment, housing, and transportation are unevenly aligned, distance becomes a constraint rather than a choice. Reframing the debate around spatial structure shifts attention from individual behavior to the systems that organize metropolitan life.
Carencia is not a fixed attribute of people or places. It is produced through the spatial organization of cities—and, as such, it can be reshaped. By making visible where effort accumulates and where access concentrates, spatial analysis offers an opportunity to rethink how metropolitan systems support daily life. In doing so, it invites a broader conversation about how cities can be organized not only to function, but to allow more of their residents to move through them with greater ease, dignity, and time.
Analysis takeaways:
- Carencia is not an individual condition, but a spatial one**, produced by the misalignment of housing, employment, and mobility across the metropolitan area.
- Distance operates as a hidden cost, redistributing time and effort unevenly across the city, particularly for residents in peripheral zones.
- Making access visible reveals opportunity, as spatial analysis helps identify where infrastructure, housing, and employment can be better aligned to support daily life.
Footnotes
-[1] Combi (Volkswagen Kombiwagen). Short for Volkswagen Kombiwagen. In the Greater Mexico City Metropolitan Area, this nickname is commonly used to refer to vans that function as a form of collective public transport. Although smaller than buses, combis play an important role in connecting peripheral areas with central parts of the city, particularly where formal transit coverage is limited.
-[2] Spatial normalization and hexagonal grid. To enable consistent comparison across the metropolitan area, all variables were aggregated using a hexagonal grid with cells of approximately one square kilometer. Hexagons were chosen to reduce edge effects and spatial bias associated with irregular administrative boundaries, allowing patterns to be examined across space rather than within jurisdictional units.
-[3] Population density and census data. Population density data were obtained from the 2020 Population and Housing Census conducted by INEGI (Instituto Nacional de Estadística y Geografía). Economic corridors were identified using publicly available datasets on formal economic activity and employment concentration. All variables were spatially aggregated to the hexagonal grid to allow direct comparison across layers.
-[4] Economic corridors data (DENUE – INEGI). Economic corridors were identified using data from the Directorio Estadístico Nacional de Unidades Económicas (DENUE), produced by INEGI. DENUE provides georeferenced information on formal economic establishments across Mexico. Establishments were spatially aggregated and analyzed to identify areas of higher concentration of formal economic activity, which are interpreted here as economic corridors. These data were aggregated to the same hexagonal grid to enable comparison with population density, housing pressure, and transportation accessibility.
-[5] Short-term rental listings (Inside Airbnb). Short-term rental data were obtained from Inside Airbnb, an independent, publicly available dataset that compiles information on Airbnb listings across cities worldwide. Listings for the Greater Mexico City Metropolitan Area were used as a proxy for short-term rental activity and aggregated to the hexagonal grid. This analysis does not assess legality, regulatory compliance, or occupancy rates; listings are interpreted as an indicator of spatial market pressure rather than individual hosting behavior.
-[6] Public transportation accessibility and street network data (OpenStreetMap). Street network data used for the accessibility analysis were sourced from OpenStreetMaps and processed using network analysis techniques. Public transport stops were scraped from OpenStreetMap and analyzed along the street network to calculate the number of stops reachable within a 20-minute walking distance from each street segment. Network-based distances were used instead of straight-line buffers to better reflect how mobility is experienced in everyday urban environments. OpenStreetMap was used because official public transportation datasets are available only for Mexico City, while comparable, region-wide data for the State of Mexico and Hidalgo are not publicly accessible.