Cycling Infrastructure in Mexico City: Distribution, Equity and Opportunity

It’s great to see our streets change to better accommodate people riding a bicycle or walking on foot. To make this change sustainable, let’s together make sure our streets’ culture changes, too!
— Christoph Fink, 2020
Introduction
As a cheap and sustainable alternative to mobility, cycling has become an increasing option to travel throughout cities (United Nations Regional Information Centre for Western Europe, 2025). It is not only a sustainable and low cost option for mobility but it also takes on different Sustainable Development Goals, as it allows people to access different urban equipment, jobs, and even a healthier lifestyle. For that alone, Mexico City has embraced the usage of the bicycle as a main way of mobility and has made a great investment for the last 10 to 12 years. In the last 3 years, Mexico City rental bicycles network usage has increased year by year more that 80% (Ecobici, 2025). However, as a cyclist myself, I have experienced firsthand, both the benefits of having an ever growing cycling infrastructure network, and the uneven presence of the asset across the city. The following analysis has the goal of understanding the current configuration of the cycling infrastructure in Mexico City, specifically the one that will be addressed as confined infrastructure and therefore also safer, how it is spatially distributed and who benefits the most from it.
To fulfill the aim of this document, we will try to answer the following question:
How is cycling infrastructure distributed as an urban asset across Mexico City, and how does this distribution relate to income levels, population density, and traffic safety patterns?
This document is primarily addressed for academics and urban planners who are involved in the field of spatial justice and urban planning and policy making.
Datasets and Methodology
Datasets as Asset Indicators
Cycling Mobility Network
The first asset to be described is the cycling mobility network in Mexico City. As of March 2025, this network has around 580 kilometers, made out of 651 different sections (Secretaría de Movilidad, 2025). However, this 651 sections is classified in 7 different types of cycling infrastructure which are specified in the dataset and in the Cyclist Guide (Servicio de Transporte Eléctricos de la Ciudad de México, 2024) and in the Mobility Cycling Policy for Mexico City brochure (Secretaría de Movilidad, 2024):
- Confined cycle track
- Two-way confined cycle track
- Temporary protected cycle track*
- Bus–bike shared lane
- Bicycle priority lane
- Painted cycle lane
- Shared-use path
However, due to the difference of some of the categories being confined and others not, I reclassified them for this analysis in the following way:
Safe Cycling Infrastructure (High-Value Asset)
- Confined cycle track
- Two-way confined cycle track
Less Protected Cycling Infrastructure (Low-Value Asset)
- Bus–bike shared lane
- Bicycle priority lane
- Painted cycle lane
- Shared-use path
However the category Temporarily protected cycle track was discarded from the dataset used for the analysis as it is a cycling infrastructure only available from 8 a.m. to 2 p.m. on Sundays, as main avenues are closed to allow the bicycle traffic to take place during that timeframe.
Income (Socioeconomic Context)
The second dataset used for this analysis is the one provided by the Instituto de Planeación Democrática y Prospectiva for the 2018 year trimonthly per capita income level. It is only available in a hexagonal grid (in which each grid was determined to have an area of 1.8 square kilometers). The difficulty regarding this dataset was the fact that it had no single hexagons but multiple dissolved geometries, which complicated the use of the dataset alone.
Population Density (Demand Indicator)
The third used dataset was made using an hexagonal grid (each hexagon having an approximate area of 0.82 square kilometers) and aggregating the weighted value of the population by street block and therefore its population density by hexagon, these last values derived from the national census conducted by INEGI in 2020.
Traffic Accidents (Asset Performance Context)
The last used dataset was cycling traffic accidents. This dataset was developed during 2019 and offers an insight to traffic accidents where cyclists were injured or killed. This dataset was cleaned by removing the cyclists only accidents and grouping vehicles in different categories:
- Automobiles: Car and taxi.
- Motorcycles
- Public transport (Bus): Passenger bus, Microbus, Metrobus, Trolebus
- Freight Vehicle (Trucks)
Analytical Approach
In order to be able to compare the datasets between them, it was necessary to standardize the spatial unit of analysis. Since the income dataset was only available in hexagonal format, I decided to use the hexagon as the main spatial unit across the analysis.
The cycling infrastructure dataset, which is originally composed of line geometries, was filtered using the municia¿pal boundaries within Mexico City in order to calculate the total length of each type of cycling infrastructure within each municipality. This step allowed me to understand not only where the infrastructure is located, but how concentrated it is in relation to income and density.
The choice of using hexagons instead of administrative boundaries was intentional. Administrative boundaries such as municipalities can hide internal variation and can give the impression of homogeneity where it does not exist. The hexagonal grid allows for a more granular understanding of spatial patterns and avoids the distortions that irregular polygons may create.
Results
Income Composition and Spatial Context
The first chart shows the income composition of the urbanized land area by municipality. As it can be observed, municipalities such as Miguel Hidalgo, Benito Juárez and Cuauhtémoc concentrate a higher share of high income ranges, while municipalities located in the eastern and southern parts of the city, such as Iztapalapa, Tláhuac and Xochimilco, have a greater proportion of lower income ranges. It is important to mention that this analysis excludes rural areas due to lack of income data, and therefore the percentages refer only to urbanized land.
This socioeconomic distribution provides the context to evaluate how cycling infrastructure as an asset is spatially distributed.
The figure was made using Flourish.
Cycling Infrastructure as an Urban Asset
The second chart presents the total length of cycling infrastructure by type and municipality. It can be observed that confined cycling infrastructure is mainly concentrated in central municipalities such as Cuauhtémoc, Benito Juárez and Miguel Hidalgo. These municipalities not only have a higher presence of infrastructure, but also a greater proportion of the safer type, meaning physically separated cycle tracks.
Peripheral municipalities such as Iztapalapa, Tláhuac and Xochimilco have infrastructure presence, but it is mostly composed of non-confined lanes such as painted cycle lanes or shared-use paths. While these still represent an asset for mobility, their level of protection is lower and therefore their value in terms of safety is different.
This suggests that the high-value cycling asset is spatially concentrated in the economic and historical center of the city.
This figure was made using Flourish.
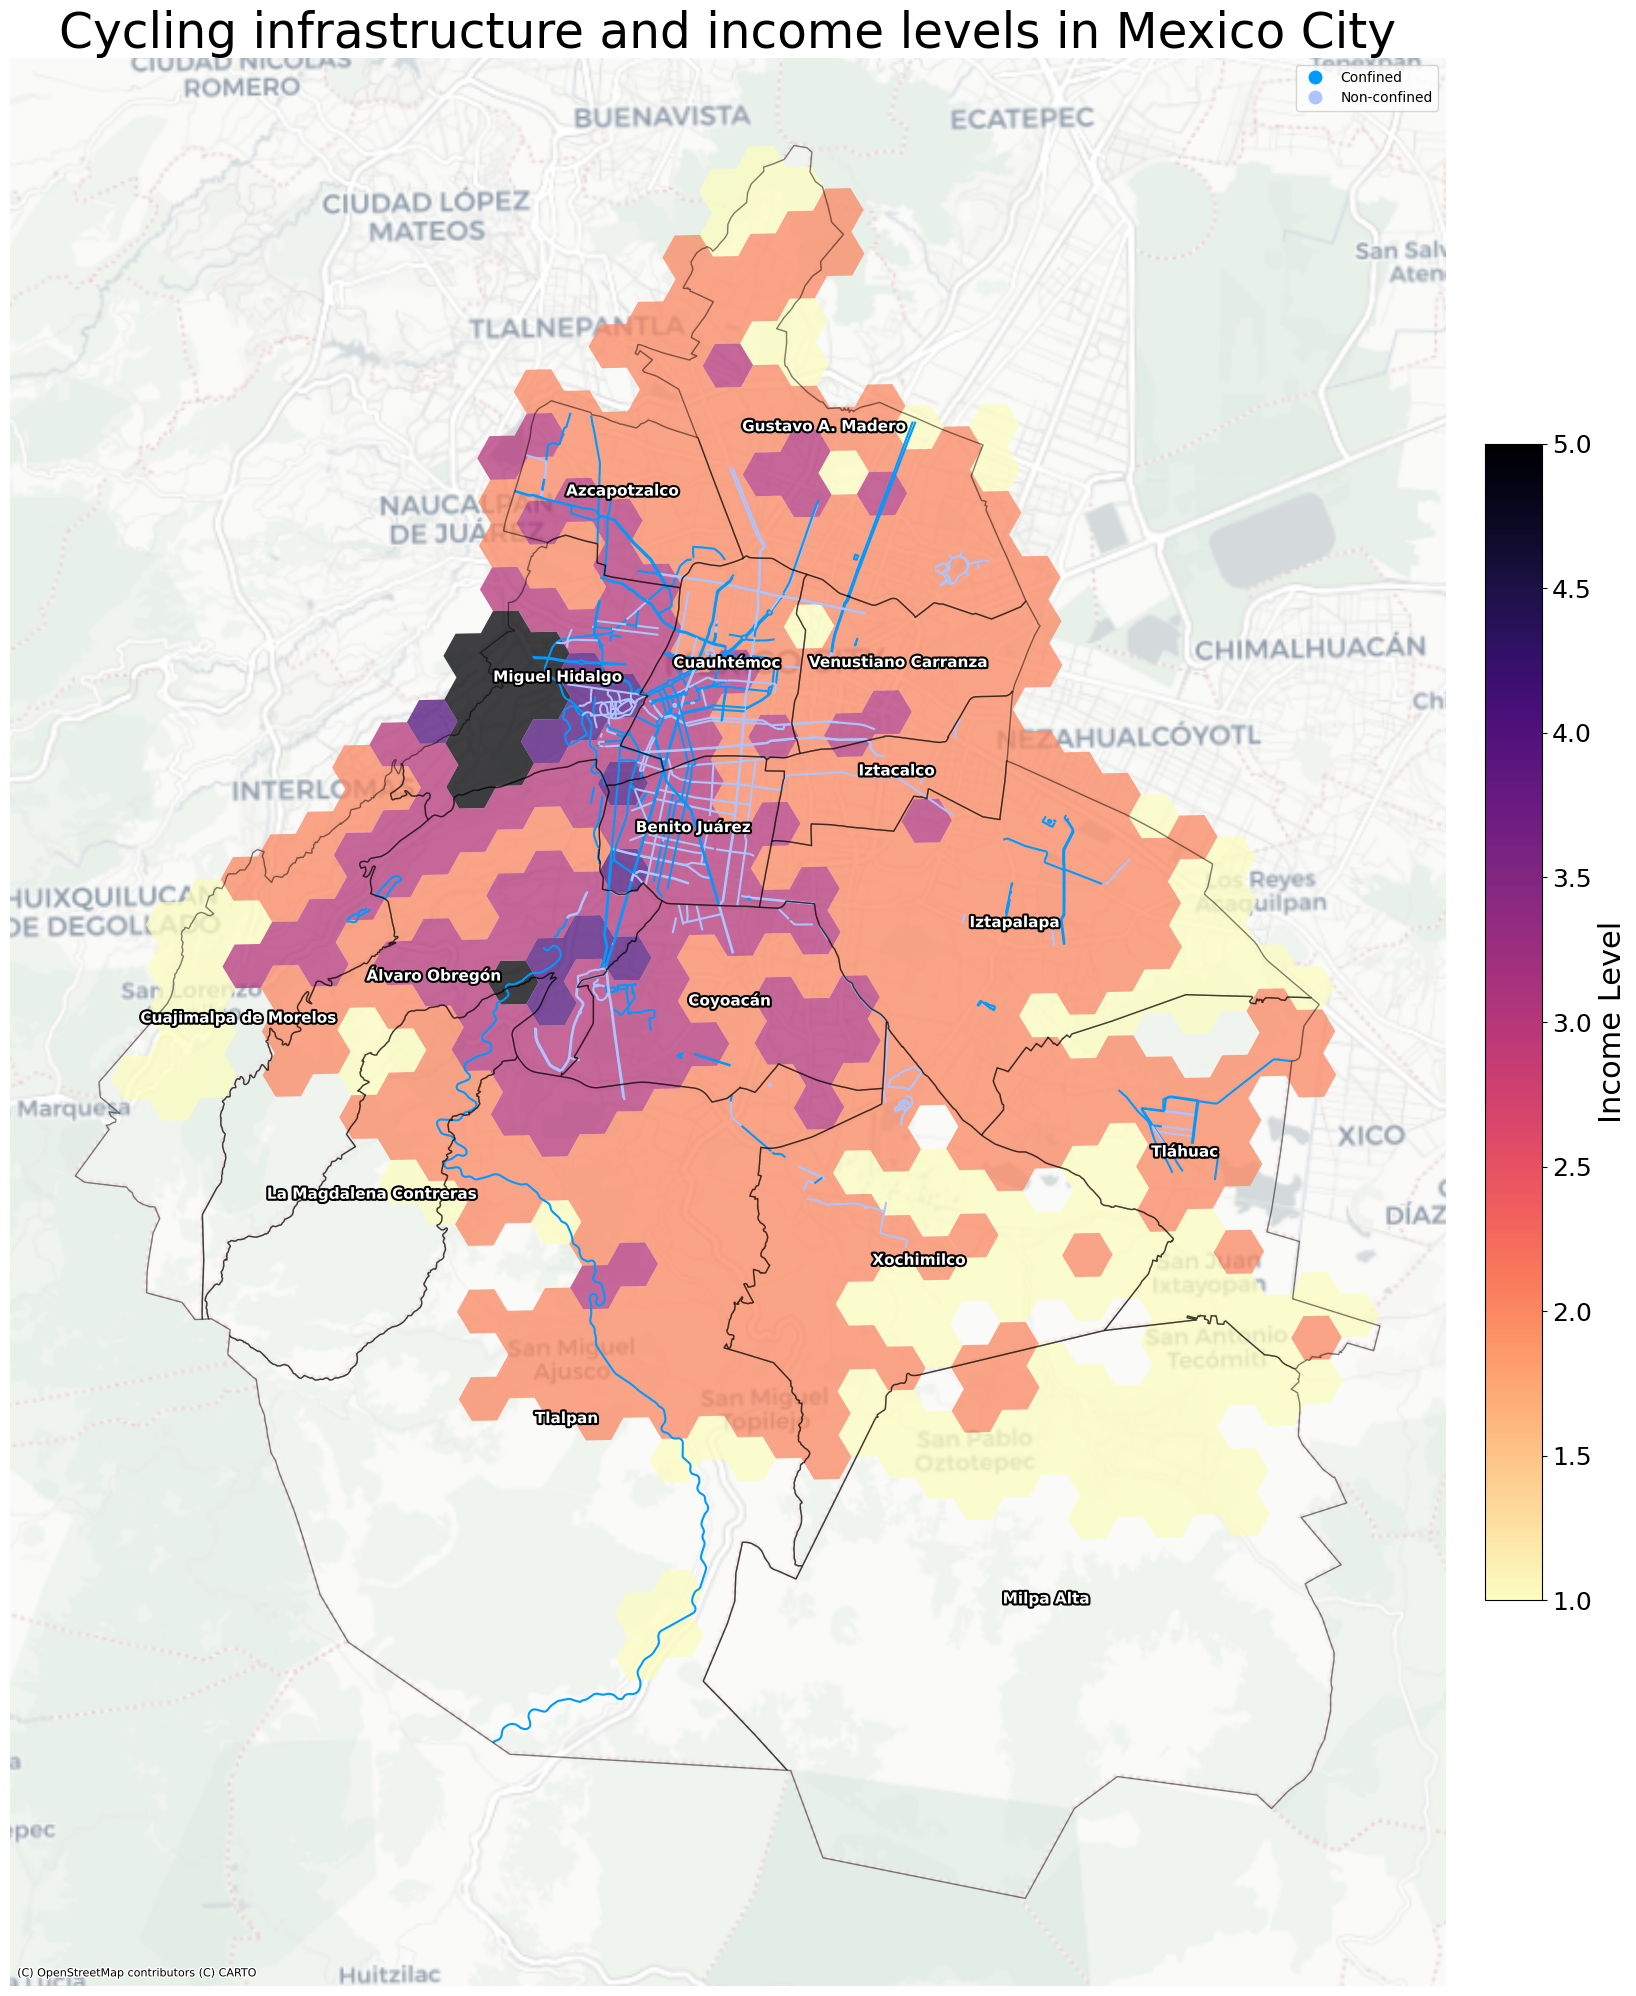
Income and Infrastructure Overlay
When overlaying income levels with cycling infrastructure, it can be observed that confined cycling infrastructure (and also the infrastructure as a whole) overlaps significantly with medium to high income hexagons located in the central corridor of the city. Areas such as Miguel Hidalgo, Benito Juárez and parts of Cuauhtémoc show both higher income levels and higher concentration of confined infrastructure.
This does not necessarily imply intentional inequality, but it does show that the strongest cycling backbone of the city is located in areas that are already economically advantaged.
In contrast, lower income areas located in the east and south of the city have less presence of cycling infrastructure.
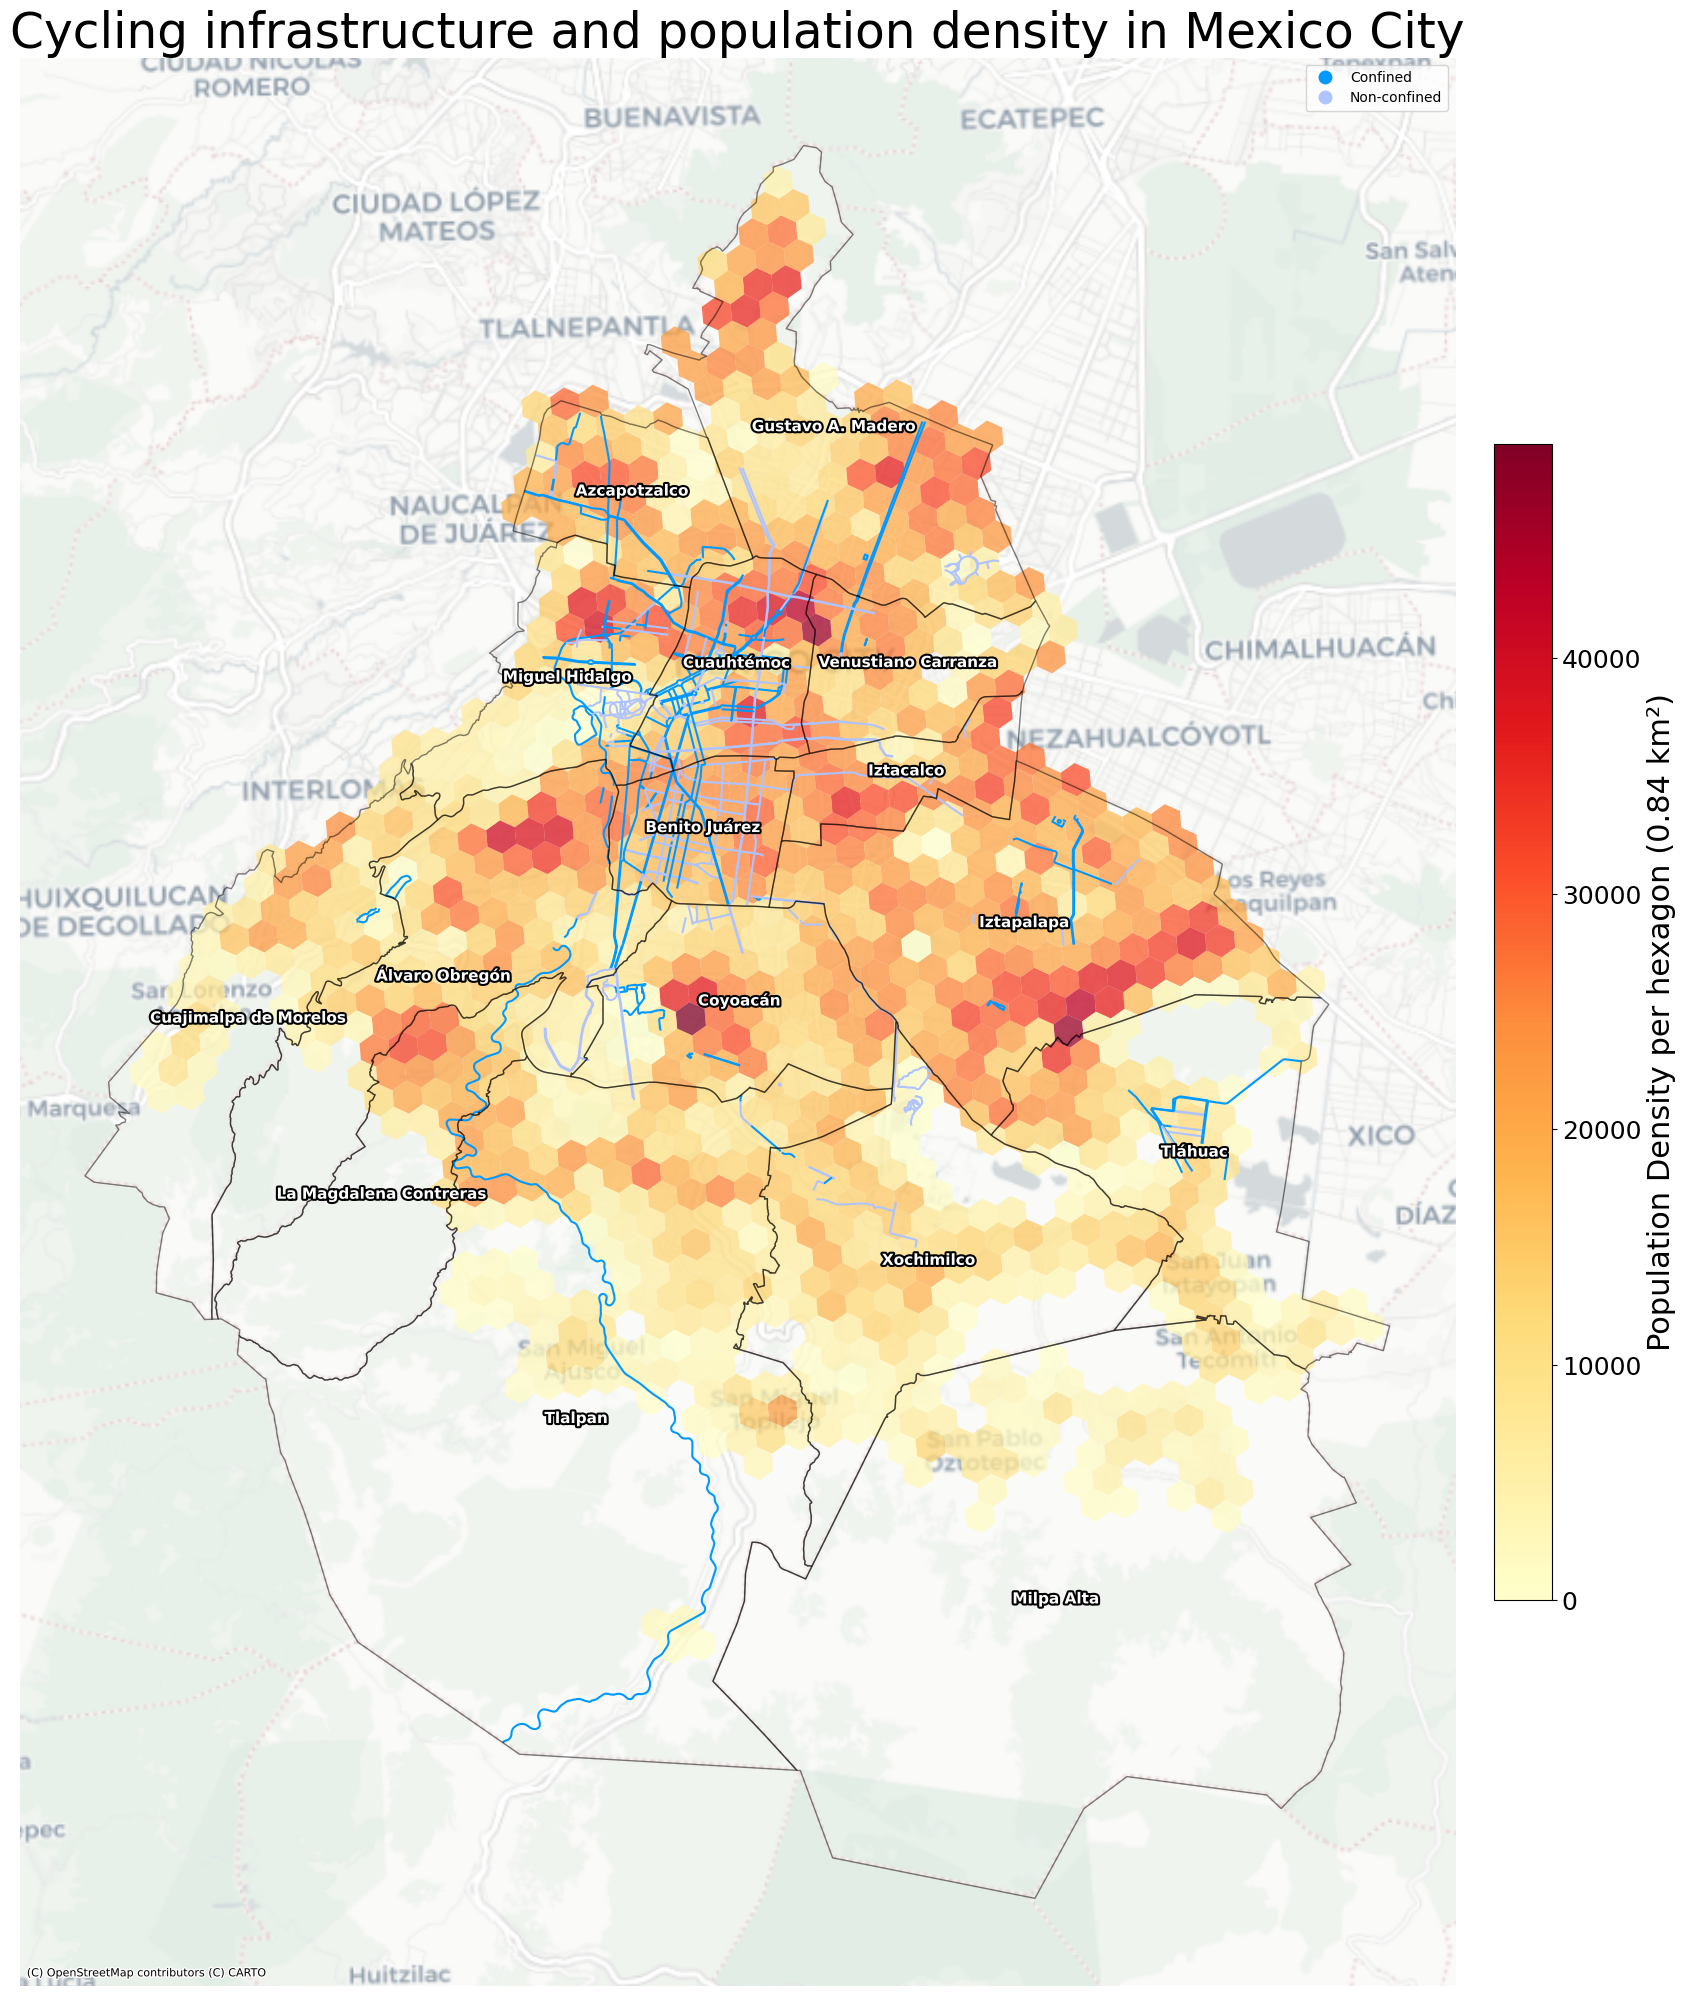
Population Density and Infrastructure Alignment
The population density map shows that high density is not limited to the central municipalities. In fact, several peripheral municipalities show very high density values, particularly in Iztapalapa and Gustavo A. Madero.
However, when observing the cycling infrastructure overlay, it becomes clear that high density does not always correspond with high presence of confined infrastructure and even connectedness to the cycling mobility network. Some of the most dense hexagons in the eastern part of the city lack the same level of cycling asset as the central corridor.
This suggests that there is an opportunity for the expansion of confined infrastructure toward areas where potential demand, measured by density, is high.
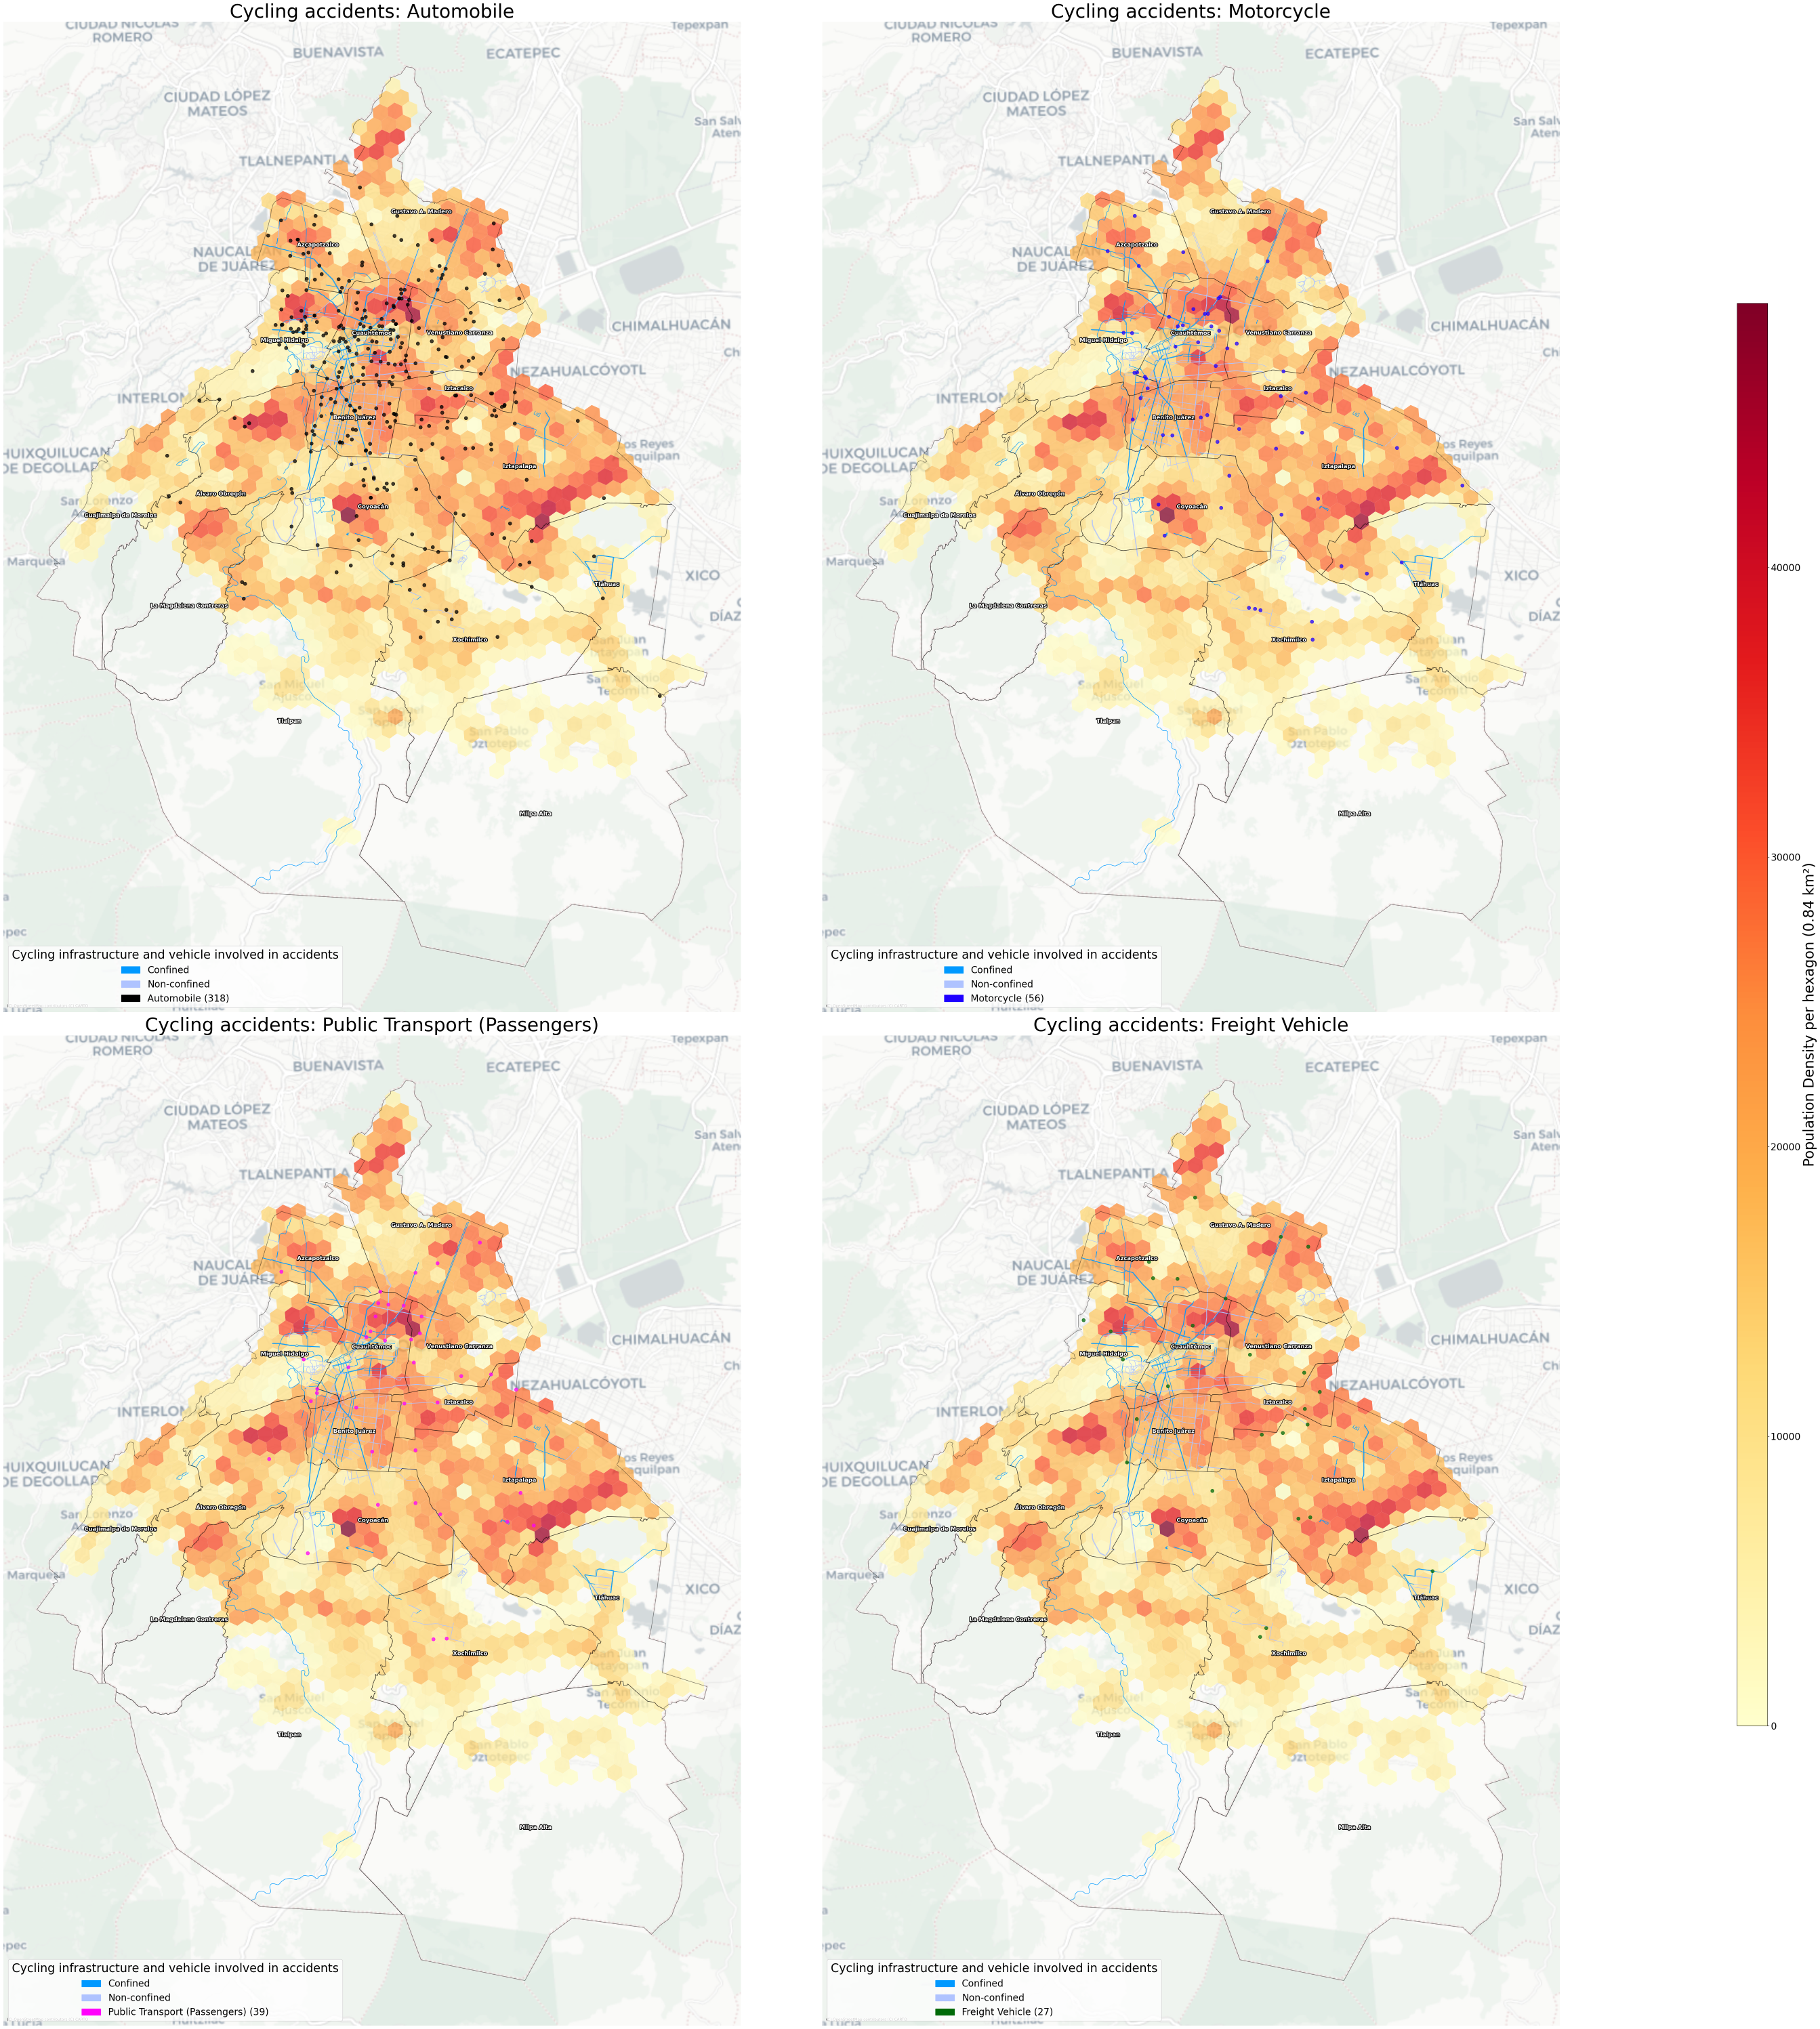
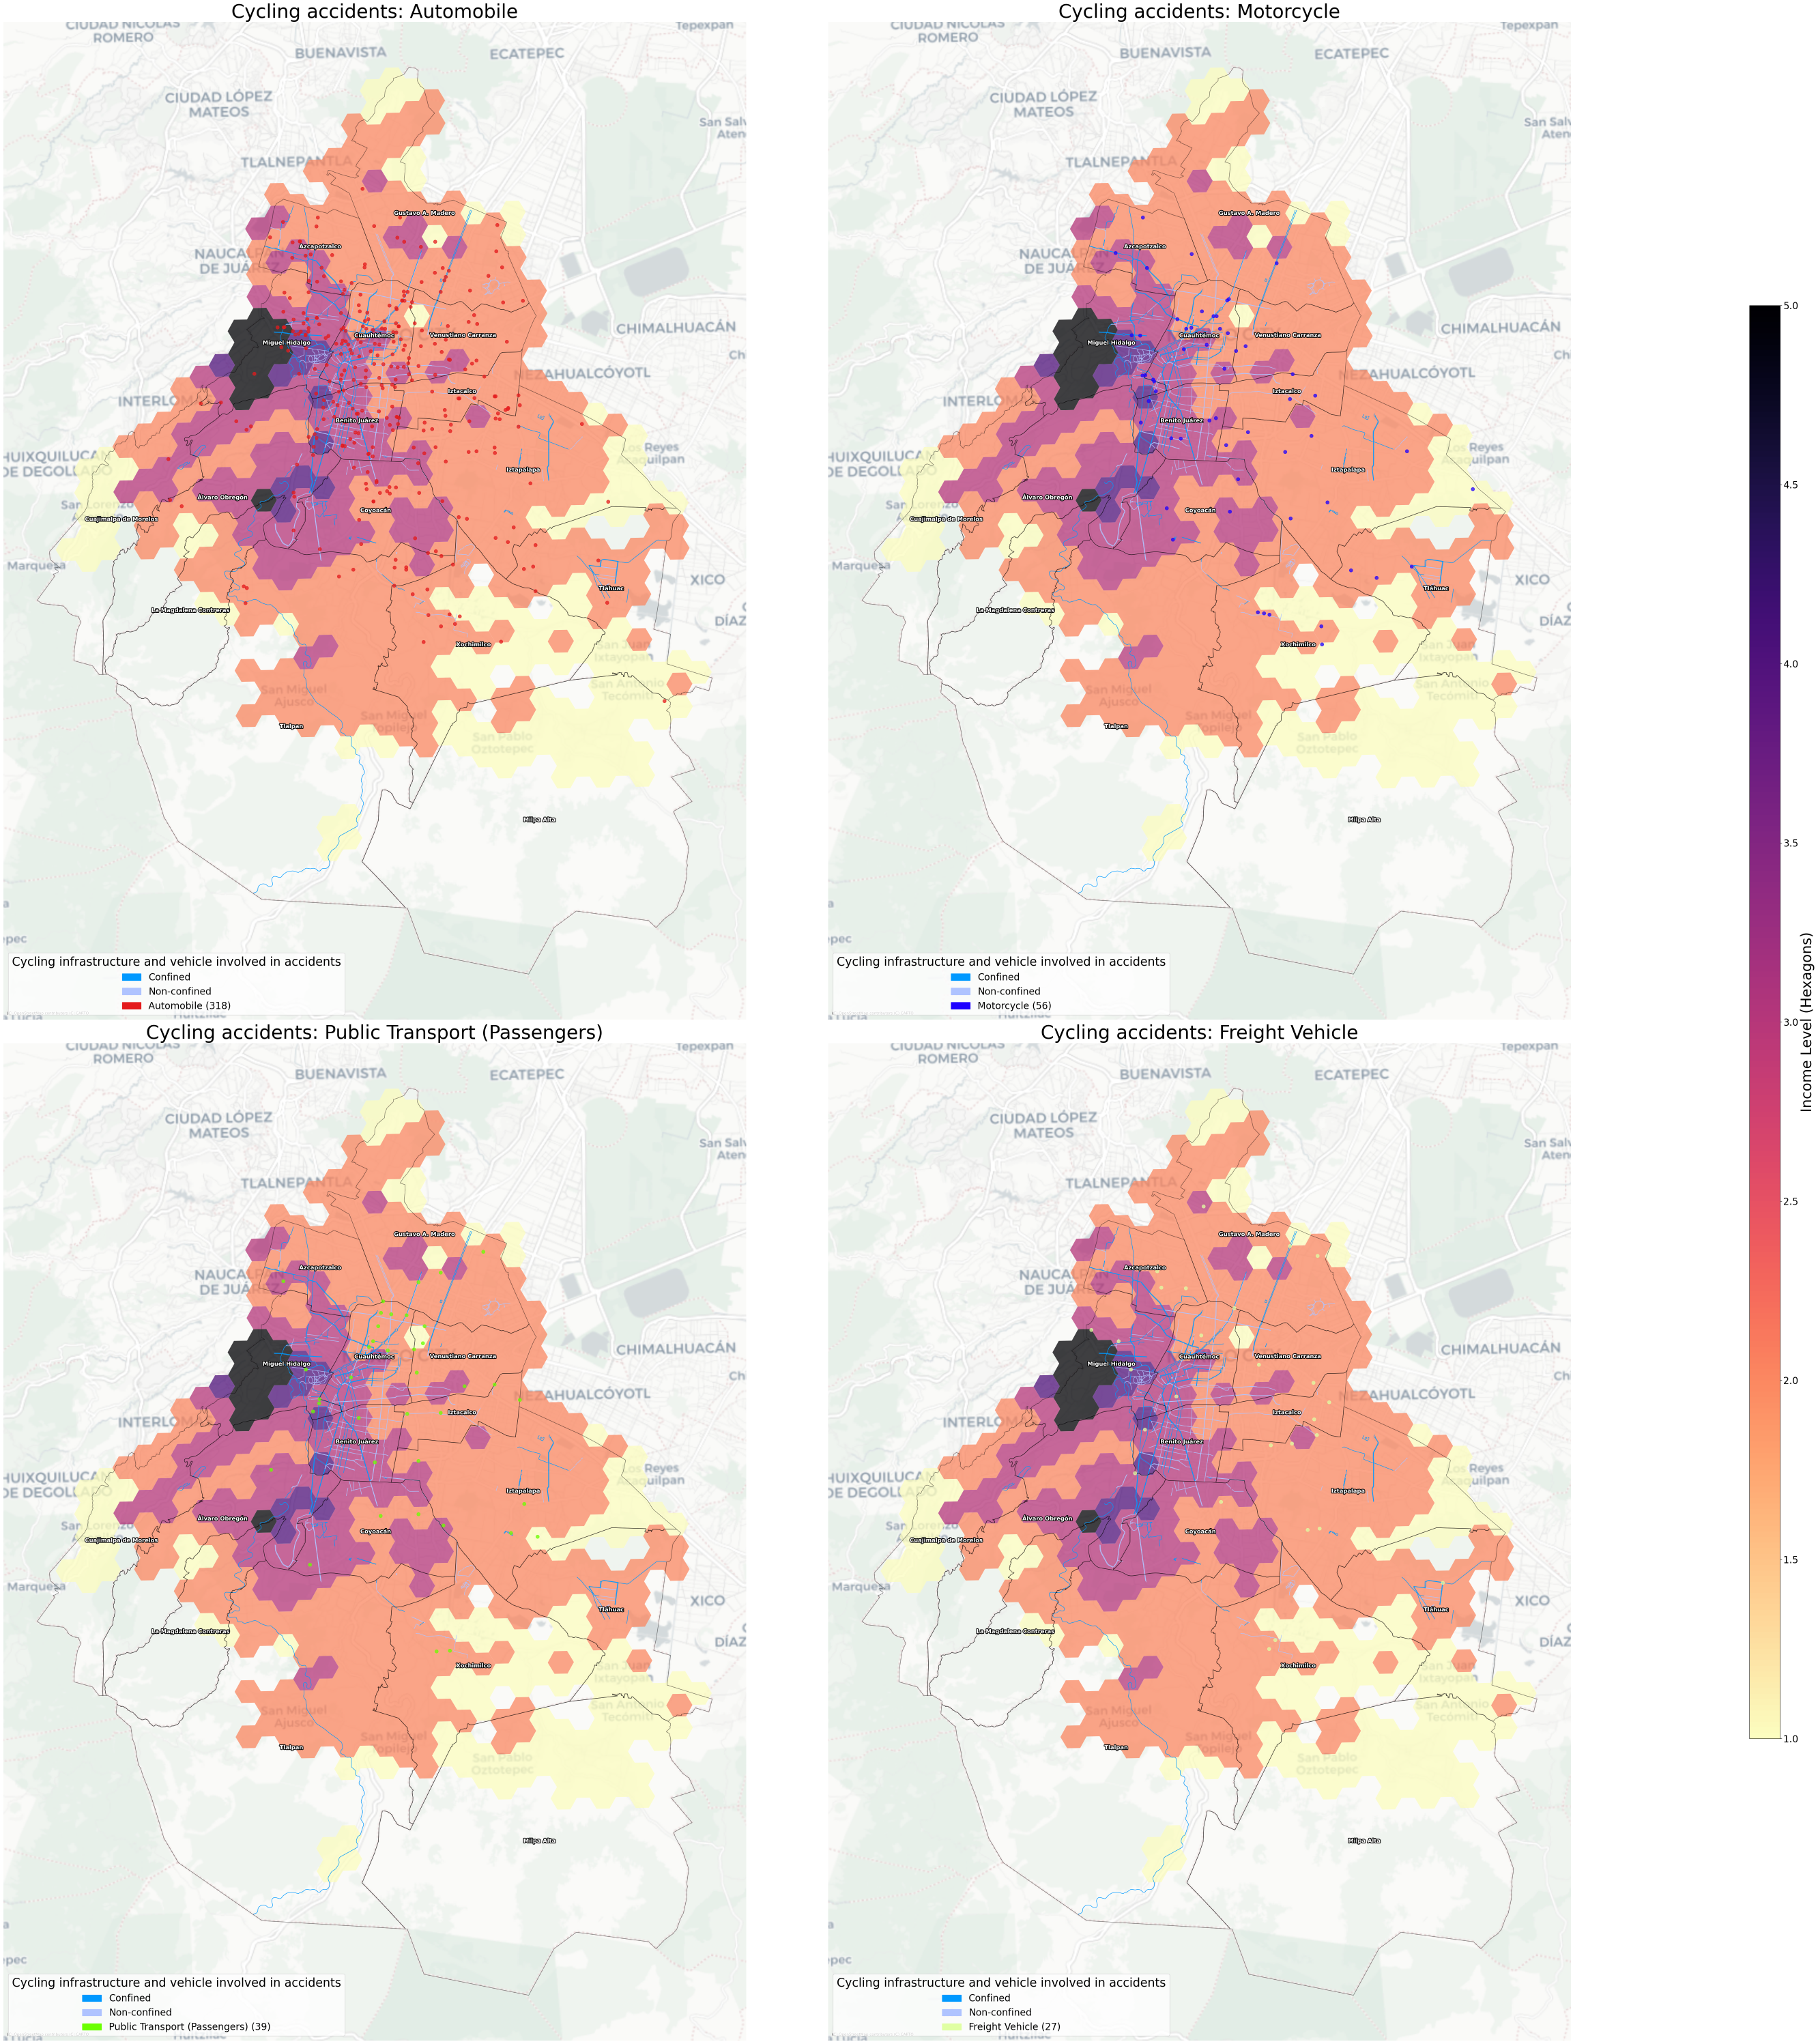
Traffic Accidents and Asset Performance
The accident maps, disaggregated by vehicle type, show a concentration of incidents in the central corridor of the city. Automobiles and motorcycles represent the majority of the vehicles involved in accidents with cyclists.
It is important to note that many of these accidents occur in areas where cycling infrastructure exists, but not necessarily confined infrastructure. The presence of non-confined lanes in mixed traffic conditions increases the interaction between cyclists and motor vehicles.
Additionally, there has been an increase in the invasion of cycling lanes by motorcycles and automobiles, which affects the effective performance of the cycling infrastructure as a protected asset. Even if infrastructure is present, its protective value can be reduced when enforcement is weak (A S., 2025).
Rather than framing these areas only as dangerous, they can also be understood as zones where the cycling asset is under high pressure due to multimodal interaction and high traffic intensity.
Conclusion
Cycling infrastructure in Mexico City represents a significant urban asset that supports sustainable mobility, access to opportunities and healthier lifestyles. Over the past decade, the city has invested considerably in expanding this network.
However, the spatial analysis shows that the high-value confined infrastructure (and cycling infrastructure as a whole) is concentrated in central, economically advantaged areas, while peripheral and lower income municipalities rely more on less protected infrastructure. At the same time, high density areas outside the central corridor do not always have equivalent levels of safe cycling infrastructure.
The accident patterns suggest that where infrastructure quality is lower and interaction with automobiles and motorcycles is higher, the cycling asset operates under greater pressure.
This does not indicate the absence of investment, but rather highlights the opportunity for a more balanced and strategic expansion of confined infrastructure toward high density and lower income areas. Strengthening enforcement to prevent lane invasion and upgrading non-confined lanes into confined infrastructure could enhance the overall value of cycling as an urban asset.
In this sense, cycling infrastructure should not only be seen as a transportation project, but as a spatial justice tool that can contribute to a more equitable and sustainable urban mobility system in Mexico City.
References
- A S. (2025, April 1). Ciclovías de CDMX: Aumenta 270% la invasion de Motos Y autos. N+.https://www.nmas.com.mx/foro/ciudad/ciclovias-peligrosas-cdmx-aumentan-invasiones-de-vehiculos-automotores/
- Ecobici. (2025, March 5). Pedaling towards a greener future - Ecobici. https://ecobici.cdmx.gob.mx/en/pedaling-towards-a-greener-future/
- Instituto de Planeación Democrática y Prospectiva. (2018). Zonas por nivel de ingresos de los hogares. https://datos.cdmx.gob.mx/dataset/ingresos-trimestrales-2018
- Instituto de Planeación Democrática y Prospectiva. (2019). Puntos de accidentes ciclistas. https://datos.cdmx.gob.mx/dataset/puntos-de-accidentes-de-ciclistas
- Secretaría de Movilidad. (2024, August). Política de movilidad ciclista en la Ciudad de México. https://www.semovi.cdmx.gob.mx/storage/app/media/PPT/2024/Infraestructura%20vial%20ciclista%202018-2024%20.pptx.pdf
- Secretaría de Movilidad. (2025). Infraestructura vial ciclista. https://datos.cdmx.gob.mx/dataset/infraestructura-vial-ciclista
- Servicio de Transporte Eléctricos de la Ciudad de México. (2024). Cyclist Guide. https://www.ste.cdmx.gob.mx/storage/app/media/Otros-Servicios/Guia-del-ciclista.pdf
- United Nations Regional Information Centre for Western Europe. (2025). Cycling and Sustainable Development Goals. Regional Information Centre for Western Europe. https://unric.org/en/sustainable-development-goals-cycling/